# summary of the 8 congressional WI districts and the 2012 voting results
district_elections <- results_house |>
  mutate(district = parse_number(district_id)) |>
  group_by(state, district) |>
  summarize(
    N = n(),
    total_votes = sum(general_votes, na.rm = TRUE),
    d_votes = sum(ifelse(party == "D", general_votes, 0), na.rm = TRUE),
    r_votes = sum(ifelse(party == "R", general_votes, 0), na.rm = TRUE),
    .groups = "drop"
  ) |>
  mutate(
    other_votes = total_votes - d_votes - r_votes,
    r_prop = r_votes / total_votes,
    winner = ifelse(r_votes > d_votes, "Republican", "Democrat")
  )
wi_results <- district_elections |>
  filter(state == "WI")
wi_results |>
select(-state)Maps Mini Project: Gerrymandering
Introduction
We are interested in seeing the difference in Democratic and Republican votes. The use of geospatial data will be useful in helping us understand. We are emulating our analysis of potential gerrymandering in Wisconsin. Our analysis focuses on the Federal Election Commission, specifically for the state of Wisconsin in the 2012 Presidential Election. This dataset, results_house, comes from the Federal Election Commission library. Results_house includes information on the the number of districts a particular state has, whether a candidate from that district is from the Republican or Democratic Party, the general number of votes in the election. We begin with determining how many congressional candidates there are for each district in the United States.
Note that there are 435 Representatives in the US House, but there are 445 state and district combinations in our data because the fec12 dataset includes the US Territories of: Guam, Puerto Rico, American Samoa, Northern Mariana Islands, District of Columbia, the Virgin Island.
However, we are only interested in the eight congressional districts in Wisconsin.
Analyzing Votes by District in Wisconsin
Here, we are summing up all the general_votes for the Democratic and Republican Party for the state of Wisconsin. Notice that we are not super interested in any Third Party candidates, but we are interested in knowing the proportion of Democratic and Republican votes.
Proportion of Republican and Democratic Votes
First, we are interested in the mean of the total votes across all 8 congressional districts. Approximately 357796 individuals from each congressional district voted, with a standard deviation of 19345. With that information, we are able to calculate the total amount of Republican and Democratic votes, and the proportion of Democratic and Republican votes for the entire state of Wisconsin.
Winner of Each District
Now, we are able to analyze the proportion of Republican voters, in addition, to the party that won in that congressional district. Notice, a bigger difference from 0.50 the better. For the state of Wisconsin, the Republican Party seems to have won in a majority of the congressional districts. However, notice that the Republican Party wins by a slight margin, whereas the Democratic Party won by a much larger margin. In other words, there is a more significant difference between the Democratic and Republican votes. Now that we have the numbers, let us visualize the data.
Visualization of Potential Gerrymandering in Wisconsin
#first, let us download the fec12 dataset from UCLA

src <- "http://cdmaps.polisci.ucla.edu/shp/districts113.zip"
lcl_zip <- fs::path(tempdir(), "districts113.zip")
download.file(src, destfile = lcl_zip)
lcl_districts <- fs::path(tempdir(), "districts113")
unzip(lcl_zip, exdir = lcl_districts)
dsn_districts <- fs::path(lcl_districts, "districtShapes")

# read shapefiles into R as an sf object
st_layers(dsn_districts)

# be able to read as a data frame as well
districts <- st_read(dsn_districts, layer = "districts113") |>
  mutate(DISTRICT = parse_number(as.character(DISTRICT)))
head(districts, width = Inf)
class(districts)


#Append election results to geospatial data
wi_merged <- districts |>
  filter(STATENAME == "Wisconsin") |>
  st_transform(4326) |>
  inner_join(wi_results, by = c("DISTRICT" = "district"))
head(wi_merged, width = Inf)

# Color based on winning party; shows the 8 congressional districts

wi <- ggplot(data = wi_merged, aes(fill = winner)) +
  annotation_map_tile(zoom = 6, type = "osm", progress = "none") +
  geom_sf(alpha = 0.5) +
  scale_fill_manual("Winner", values = c("blue", "red")) +
  geom_sf_label(aes(label = DISTRICT), fill = "white") +
  theme_void()
wi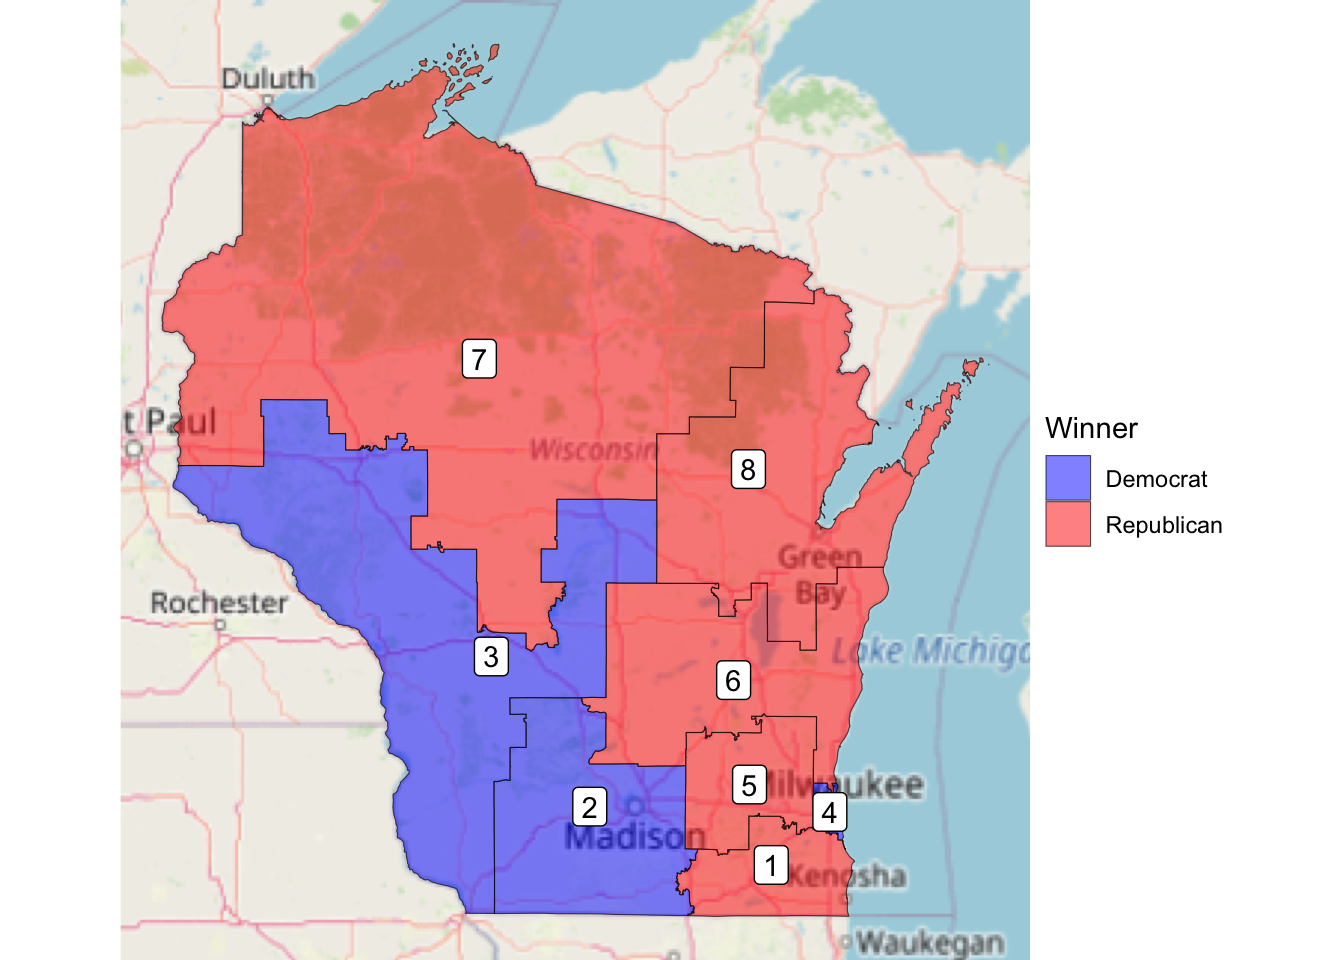
This map shows the potential gerrymandering of the eight total congressional districts in the state of Wisconsin. Note that the map is color coded such that it matches the results we found above. There are 3 congressional districts where the Democratic Party won, and 5 congressional districts where the Republican Party won. From this map, I wanted to create a choropleth map which allows us to visualize the proportion of Republican and Democratic votes in each district.
Another visualization of our potential gerrymandering
Scale for fill is already present.
Adding another scale for fill, which will replace the existing scale.
Warning in st_point_on_surface.sfc(sf::st_zm(x)): st_point_on_surface may not
give correct results for longitude/latitude data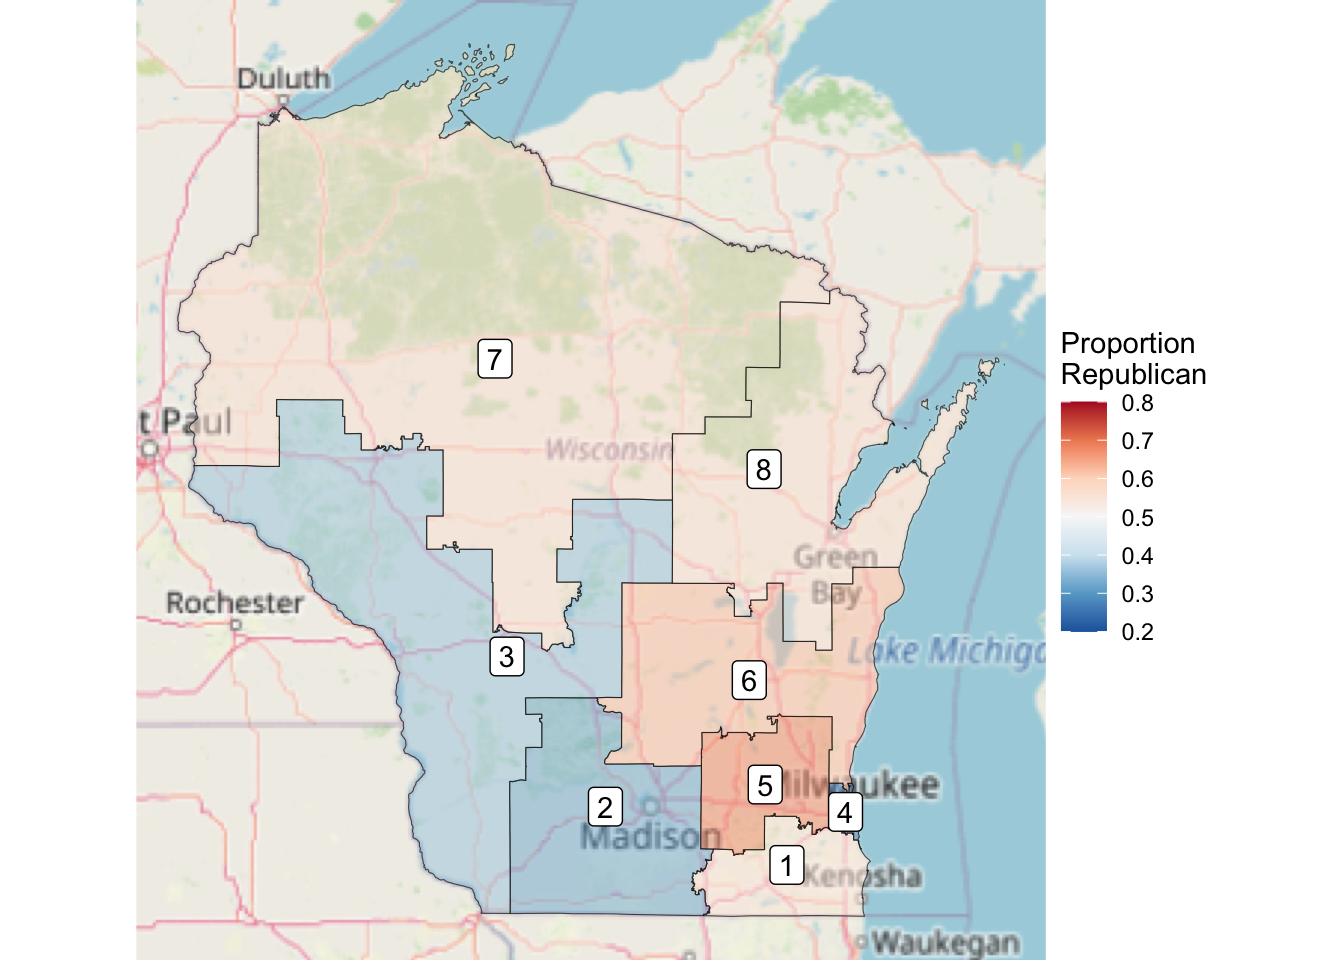
Note, this is a choropleth map, where meaningful shading relates to the proportion of Democratic and Republican votes by congressional districts. Similar to the map above, the color blue represents the Democratic Party, while the color red represents the Republican Party. Notice, this map illustrates the same information as the map above. However, in this chorpleth map, we can how much each party won, by congressional districts. We can tell the proportion of Democratic and Republican votes by how opaque the colors are on the map. If we hover our mouse over a particular place on the map, it tells us what district it is, and the proportion of votes they received.
Conclusion
It was quite interesting to explore the congressional districts data of Wisconsin. Knowing the results from the Presidential Election, I learned a lot about how the majority of the winning congressional districts does not translate to which party won in that particular state due to the electoral college. By analyzing potential gerrymandering data, we can learn more about each congressional district, and how the proportion of votes affect which party wins.